Descriptive statistics is a core idea in data science, enabling data scientists to condense and make sense of intricate datasets. By transforming raw data into understandable insights, descriptive statistics helps identify patterns, trends, and outliers, providing a clear picture of the data at hand. If you’re looking to develop a more thorough comprehension of data science, enrolling in a Data Science Course in Trivandrum at FITA Academy can help you master essential techniques like descriptive statistics and data analysis.
What is Descriptive Statistics?
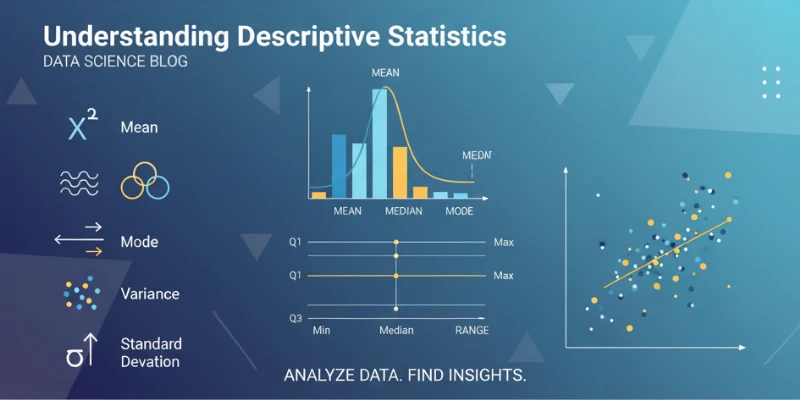
Descriptive statistics refers to techniques for organizing, summarizing, and presenting data. Unlike inferential statistics, which makes predictions about a population, descriptive statistics focuses on describing the data’s characteristics. Key measures include the mean, median, mode, range, variance, and standard deviation, each offering a unique way to summarize and understand the data.
Measures of Central Tendency
Measures of central tendency describe the center or typical value of a dataset.
- Mean: The mean is the average of all data points. It is commonly utilized, but it can be influenced by outliers, including very high or low values. For example, in a dataset of house prices, a few luxury homes might skew the mean higher than the typical price.
- Median: The median is the middle value when data is ordered. It’s more robust to outliers than the mean and is often a better representation of central tendency in skewed data.
- Mode: The mode is the most frequent value in the dataset. It’s especially useful for categorical data, like identifying the most popular product sold or the most common customer complaint.
Each of these measures provides valuable insights depending on the nature of the data. To dive deeper into data analysis and learn how to apply these concepts effectively, consider joining a Data Science Course in Kochi.
Measures of Dispersion
Measures of dispersion describe how spread out the data is.
- Range: The range indicates the disparity between the highest and lowest values in the dataset. It gives a quick sense of spread but can be distorted by extreme values.
- Variance: Variance measures how much data points differ from the mean. A higher variance means greater variability within the dataset, while a lower variance suggests more consistency.
- Standard Deviation: The standard deviation represents the square root of the variance, providing a measurement of dispersion in the original data’s units. A higher standard deviation indicates more spread-out data, while a lower value suggests the data points are close to the mean.
Together, variance and standard deviation help assess the consistency and spread of the data. To achieve a comprehensive understanding of these ideas and additional topics, signing up for a Data Science Course in Pune can equip you with the essential skills for proficient data analysis.
Importance of Descriptive Statistics in Data Science
Descriptive statistics is essential for understanding and preparing data for further analysis. It plays an important role in the early phases of data science:
- Data Cleaning: Descriptive statistics helps identify missing values, outliers, and errors. For example, reviewing the mean or standard deviation can highlight unusual data points that need attention.
- Exploratory Data Analysis (EDA): Descriptive statistics is at the heart of EDA, helping data scientists uncover trends, distributions, and relationships within the data. Summary statistics and visualizations like histograms or box plots provide a quick understanding of the dataset.
- Model Selection: Understanding the data’s characteristics through descriptive statistics informs decisions about which machine learning models to apply. For example, knowing the distribution of data can guide the choice of algorithms.
Visualizing Descriptive Statistics
Visualizations are a powerful tool for interpreting descriptive statistics. Charts such as histograms, box plots, and scatter plots help highlight trends and data distribution. A box plot, for instance, can reveal outliers and provide insight into the data’s spread, while a histogram can show if the data follows a normal distribution.
Descriptive statistics is a key tool for data scientists. It simplifies complex datasets into understandable summaries, enabling better decision-making and insights. Enrolling in a Data Science Course in Jaipur will help you develop these abilities and boost your career. By mastering measures of central tendency, dispersion, and visualization techniques, data scientists can gain a clear understanding of their data, prepare it for deeper analysis, and ultimately drive more informed decisions.
Also check: What is Data Wrangling and Why is it Important?